|
The waveforms of sounds made by musical
instruments and the human voice are very complex. The
waveform can be illustrated as a graph, comparing the
volume of the different frequencies or tones. Electronic
devices often have problems involved in accurately
reproducing those sounds.
You probably have some questions about
sound reproduction:
-
How can you show how complex sound
is?
-
How does sound get distorted when it
is detected?
-
What happens when you try to
reproduce a sound?
Showing sound complexity
A tuning fork is supposed to give off a
pure tone of one frequency or note. Hearing a tuning
fork is like looking at an object that is only one
color. But just like most objects are multicolored, the
sounds coming from most objects are very also very
complex.
One way to illustrate this is by the use
of a graph. The sound from a tuning fork is only one
frequency. The height of the bar indicates how loud the
note is. The higher the bar, the louder the note is.
With the sound from your voice, from a musical
instrument or from some other source is highly complex,
consisting of many frequencies at different amplitudes
or loudness.
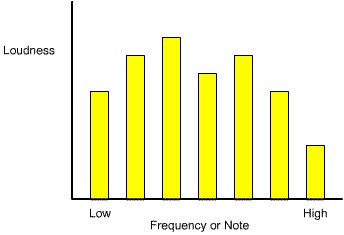
The chart below illustrates the loudness
of the different frequencies or notes in a complex
sound. The height of each bar indicates the relative
loudness or amplitude of that frequency.

Chart 1: Simple example of a complex
sound
A tuning fork would consist of only one
bar or note. Of course, a true sound would have many
more frequencies. The hearing range of humans, which is
between 20 Hz and 20,000 Hz. (Hz is the abbreviation for
Hertz, which means cycles per second.)
Detecting sound
Now when you hear a sound, your ear
filters that sound, before it travels to the brain. In
other words, it does not record the sound exactly as it
was transmitted. Some frequencies or notes may be
attenuated or reduced in volume, while others may be
recorded exactly as they are.
Likewise, when a microphone records a
sound, the some of the frequencies may be attenuated.
This is especially true with inexpensive microphones.
Such a microphone can severely distort the sound. One
good example of a distorting microphone is the
mouthpiece in most telephones.
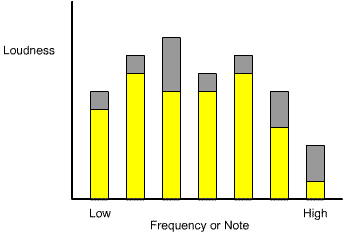
This chart below shows how the various
notes are reduced in volume due to the attenuation from
a microphone. The yellow represents the new sound.

Chart 2: Attenuation of a sound by a
microphone
Reproducing sound
After the microphone detects the sound,
it goes through some electronics and is then reproduced
and transmitted through loud speakers or headsets that
consist of tiny speakers. Just like a microphone, the
speakers also attenuate various frequencies and distort
the sound coming out.
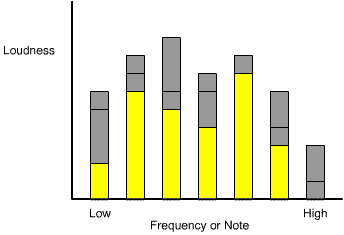
The chart below shows how the sound has
changed due to attenuation from the microphone and then
the speaker. Note that the highest frequency cannot be
heard at all.

Chart 3: Attenuation of a sound by a
microphone and speaker
Well-made speakers�which are usually
more expensive�are the most faithful in reproducing the
sound signal they receive. Since they often must produce
amplified sound, speakers often have difficulty
faithfully reproducing all frequencies.
That is why better stereo systems have
several types of speaker cones in one speaker box. They
may have a tweeter�which is good at reproducing high
notes�and a bass speaker for the lower frequencies.
Some expensive car radios and stereo
systems have what are called "equalizers" that show the
volume of the different frequencies with rows of lights.
Equalizers allow you to adjust the volume of these
individual frequencies to overcome the attenuation of
each note. This results in a sound that is closer to the
original sound.
Sounds from your voice or music are
highly complex. There is distorting or attenuation of
frequencies in the detecting and reproducing processes.
Thus, the music you hear from the radio is never quite
as good as if you would hear the original, live sound. |